How use google chart on your webpage – Google Charts API
Using Google Charts
Visualization intro illustration Google Charts provides a perfect way to visualize data on your website. From simple line charts to complex hierarchical treemaps, the chart gallery provides a large number of ready-to-use chart types.
The most common way to use Google Charts is with simple JavaScript that you embed in your web page. You load some Google Chart libraries, list the data to be charted, select options to customize your chart, and finally create a chart object with an id that you choose. Then, later in the web page.
Learn how to add Google Charts to your web page.
All chart types are populated with data using the DataTable class, making it easy to switch between chart types as you experiment to find the ideal appearance. The DataTable provides methods for sorting, modifying, and filtering data, and can be populated directly from your web page, a database, or any data provider supporting the Chart Tools Datasource protocol. (That protocol includes a SQL-like query language and is implemented by Google Spreadsheets, Google Fusion Tables and third-party data providers such as SalesForce. You can even implement the protocol on your own website and become a data provider for other services.)

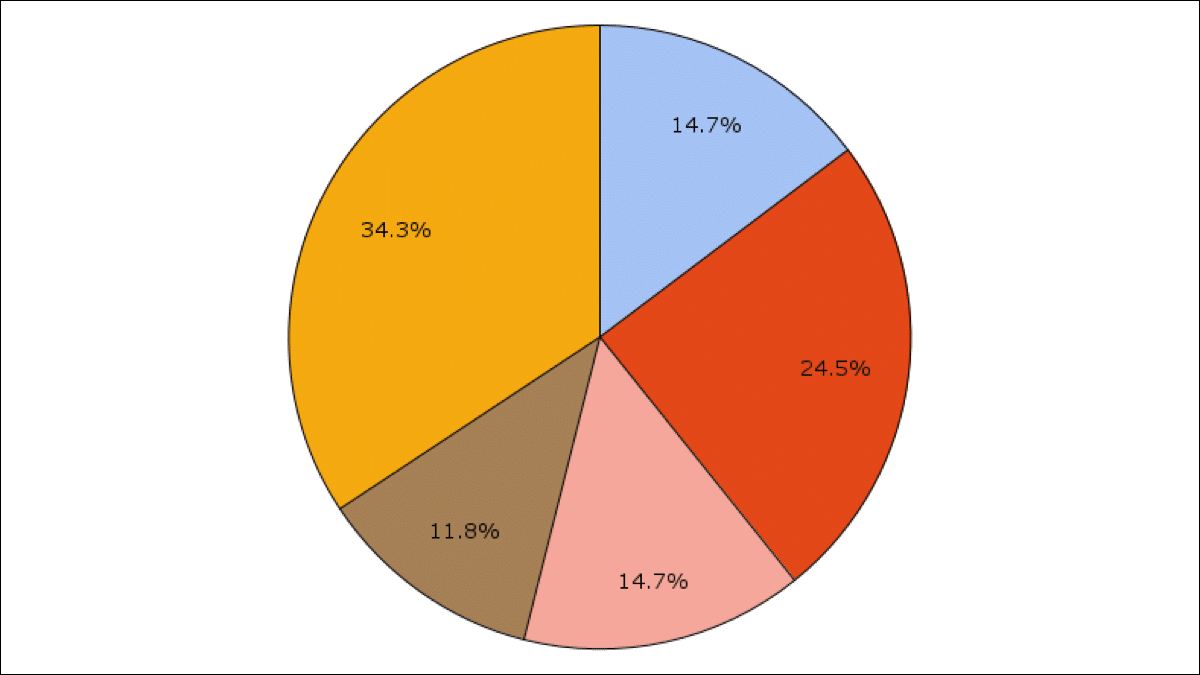
Google Pie Chart
Start with a simple basic web page.
Add a <div> element with the id “piechart”:
<!DOCTYPE html>
<html>
<body>

<h1>My Web Page</h1>

<div id="piechart"></div>

</body>
<html>
Add a reference to the Chart API at google.com:
First you must load the loader itself, which is done in a separate script tag with src="https://www.gstatic.com/charts/loader.js". This tag can be either in the head or body of the document, or it can be inserted dynamically into the document while it is being loaded or after loading is completed.
<script type="text/javascript" src="https://www.gstatic.com/charts/loader.js"></script>
And add a JavaScript function:
<script type="text/javascript">
// Load google charts
google.charts.load('current', {'packages':['corechart']});
google.charts.setOnLoadCallback(drawChart);

// Draw the chart and set the chart values
function drawChart() {
  var data = google.visualization.arrayToDataTable([
  ['Task', 'Hours per Day'],
  ['Work', 8],
  ['Friends', 2],
  ['Eat', 2],
  ['TV', 2],
  ['Gym', 2],
  ['Sleep', 8]
]);

  // Optional; add a title and set the width and height of the chart
  var options = {'title':'My Average Day', 'width':550, 'height':400};

  // Display the chart inside the <div> element with id="piechart"
  var chart = new google.visualization.PieChart(document.getElementById('piechart'));
  chart.draw(data, options);
}
</script>
Check the full document here.
If have any other questions about how to add Google Charts to your web page Just ping me a message.